Gráinne's Projects

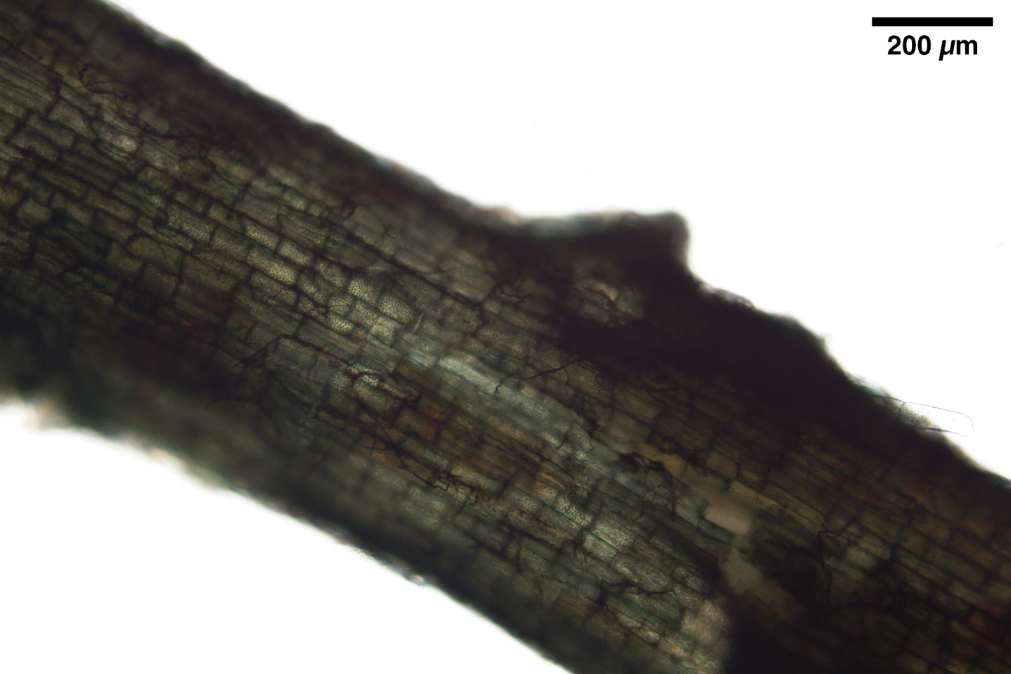
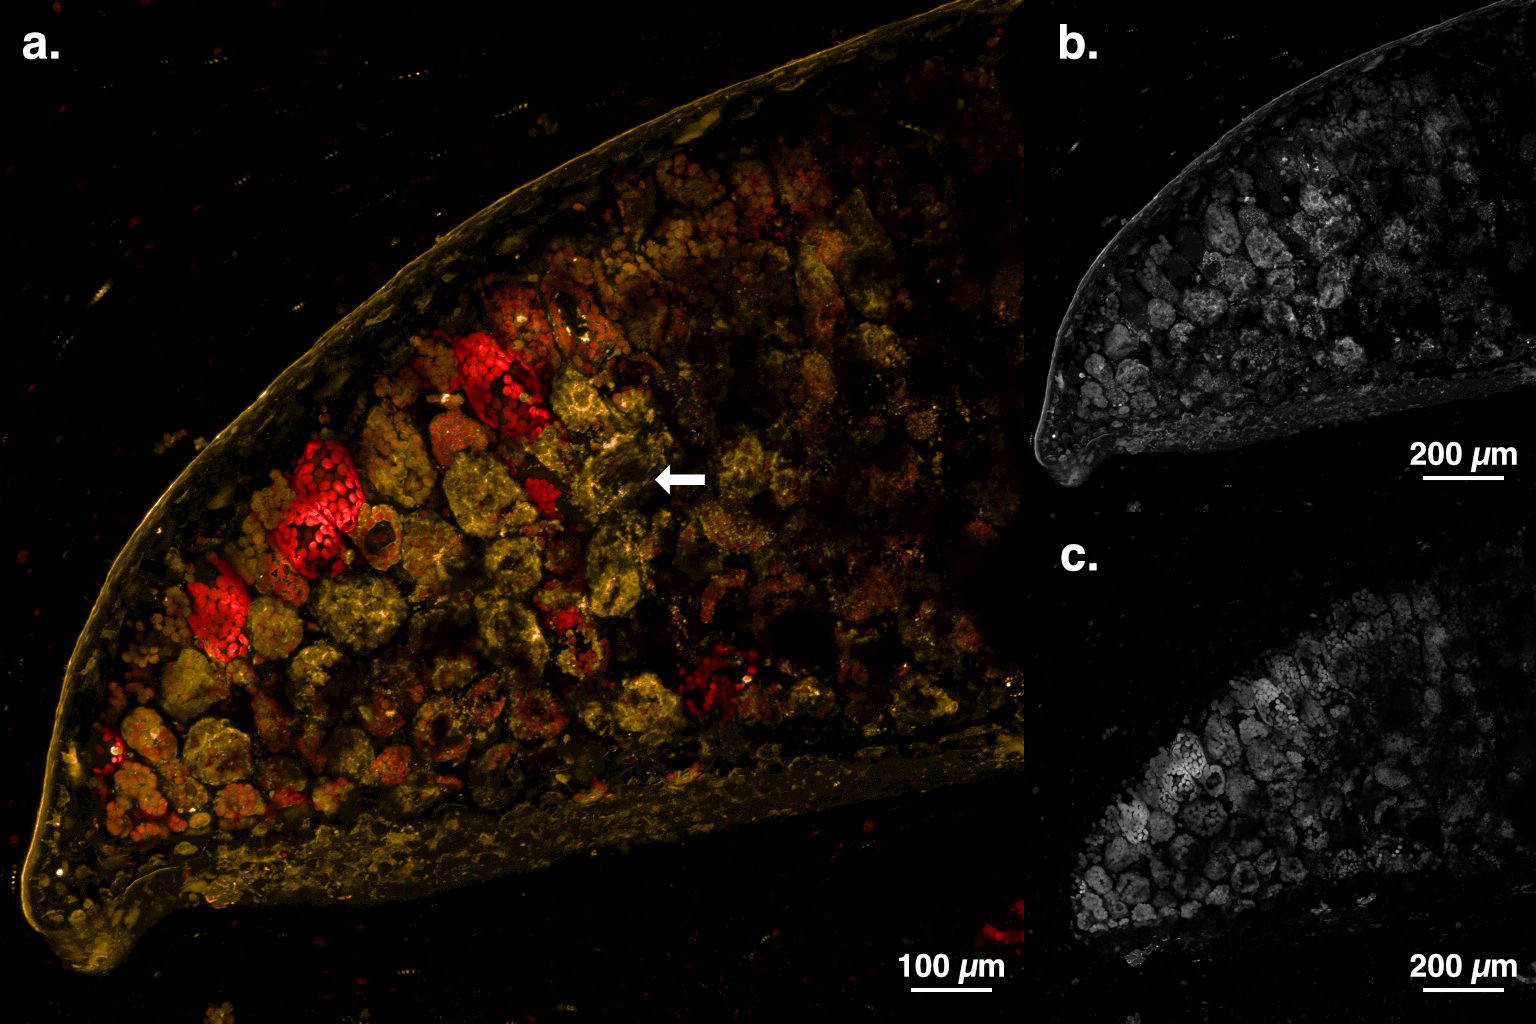
Miscellaneous Microscopy


          Comparison of the morphology of hydrated pollen grains observed in wet mount under laser scanning confocal fluorescence microscopy. Pollen was obtained from the anthers of (a) *Amaryllis* “Blushing Bride,” (b) *Parodia muricata*, (c) *Caesalpinia pulcherrima*, and (d) a Liliaceae species. The pollen grains were imaged using (a-c) a laser with wavelength 490.1 nm, resulting in autofluorescence in the green range; and (d) a laser with wavelength 405.0 nm, resulting in autofluorescence in the blue range. The micrographs show maximum intensity projections from images taken at (a) 16 and (b-d) 64 vertical positions. Images have been adjusted for contrast and false colored to show (a, b) height and (c, d) emission wavelength. Gradiated height scale bar shows (a) 28.34 µm and (b) 22.14 µm. Solid scale bar shows 50 µm in all micrographs.
        
          Comparison of pollen grains obtained from *Parodia muricata* anthers observed dry and wet. (a, c) Dry mount of pollen grains; (b, d) wet mount of hydrated pollen grains. (a, b) Brightfield transmitted light micrographs; (c, d) laser scanning confocal fluorescence micrographs, false colored to indicate emission wavelength due to autofluorescence. A laser wavelength of 490.1 nm resulted in emission in the green range. Scale bar in all micrographs indicates 50 µm.
        
          Live whole mount of four *Pseudodrynaria coronans* (also known as *Aglaomorpha coronans*) sporangia. Sporangia were hydrated and observed in wet mount under laser scanning confocal fluorescence microscopy. The micrograph shows a maximum intensity projection of autofluorescence at two different wavelengths. An excitation wavelength of 490.1 nm resulted in emission in the green range, and an excitation wavelength of 561.4 nm resulted in emission in the orange range. The image has been adjusted for contrast and false colored to indicate emission wavelength. Scale bar indicates 100 µm.
        
          Cortical and epidermal tissue of roots taken near *Kalmia latifolia*, observed under brightfield transmitted light microscopy. The roots have been cleared in KOH and stained in Chlorazol Black E. (a, c, d) The root cortex and epidermis was dissected and laid flat; (b) the root was observed as a whole mount. Several structures that appear to be fungal in origin can be seen in each micrograph: (a) possible spores can be seen (arrows labeled S) in addition to extensive hyphal colonization; (b) possible spores (arrows labeled S), a potential arbuscule (arrow labeled A), and hyphae can be seen; (c) a possible arbuscule can be seen (arrow labeled A) as well as some hyphae; (d) extensive hyphal colonization can be seen within certain cells (arrow labeled H) as well as spreading between cells. Scale bar in all micrographs indicates 50 µm.
        
          Whole mount of a root taken near *Kalmia latifolia*, overved under brightfield transmitted light microscopy. The root has been cleared in KOH and stained in chlorazol black E. Dark filamentous structures that appear to be hyphae can be seen extensively throughout the root. The edges of the root are out of focus due to the thickness of the root. Scale bar indicates 200 µm.
        
          Live cross section of a *Microsorum thailandicum* leaf in wet mount, observed under laser scanning confocal fluorescence microscopy. Each micrograph shows a maximum intensity projection of autofluorescence at (a) orange and far-red wavelengths, false colored to indicate emission wavelength; (b) orange wavelengths only; and (c) far-red wavelengths only. Orange autofluorescence was observed with a laser wavelength of 561.4 nm, and far-red autofluorescence was observed with a laser wavelength of 637.4 nm. Various cell components and structures can be visualized, including a tube-like structure (arrow). Images have been adjusted for contrast. Scale bar indicates (a) 100 µm and (b, c) 200 µm.